
Power BI and Business Central work together to provide comprehensive data analytics and visualization capabilities for businesses. Here’s an overview of how they integrate and the benefits they offer:
Integration Overview
1. Seamless Data Connection:
- Connect Power BI directly to Business Central for real-time data access.
- Use built-in connectors to simplify the integration process.
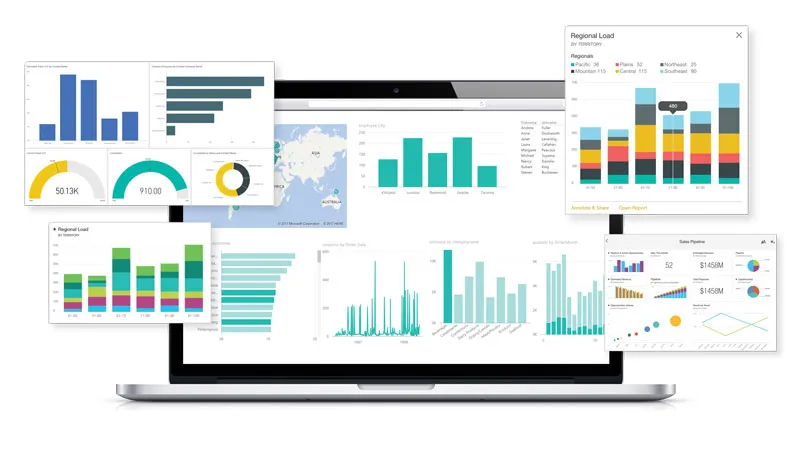
2. Customizable Reports and Dashboards:
- Create custom reports tailored to your specific business needs.
- Design interactive dashboards that display key metrics and KPIs.
3. Real-Time Insights:
- Access up-to-date information to make informed decisions quickly.
- Monitor business performance with real-time data visualization.
Key Benefits
1. Enhanced Decision-Making:
- Leverage data-driven insights to make strategic decisions.
- Use predictive analytics to forecast future trends and outcomes.
2. Improved Efficiency:
- Automate reporting processes to save time and reduce errors.
- Streamline data analysis with intuitive tools and features.
3. Increased Collaboration:
- Share reports and dashboards with team members and stakeholders.
- Collaborate on data analysis to drive better business outcomes.
4. Scalability and Flexibility:
- Scale your analytics capabilities as your business grows.
- Customize reports and dashboards to meet evolving business needs.
5. Integration with Other Microsoft Tools:
- Seamlessly integrate with other Microsoft products like Excel, Azure, and Dynamics 365.
- Enhance overall productivity and data management.
Use Cases
1. Financial Reporting:
- Generate detailed financial reports to track revenue, expenses, and profitability.
- Analyze financial trends and make data-driven budgeting decisions.
2. Inventory Management:
- Monitor inventory levels and optimize stock management.
- Identify trends in sales and inventory turnover.
3. Sales Analysis:
- Track sales performance and identify top-performing products.
- Analyze customer behavior and sales trends.
4. Operational Efficiency:
- Evaluate operational processes and identify areas for improvement.
- Monitor key operational metrics to ensure optimal performance.
Integrating Power BI with Microsoft Business Central can transform how your business analyzes and uses data, leading to more informed decisions and improved operational efficiency.
Implementation Steps
- Data Connection
- Set up a data connection between Business Central and Power BI using the built-in connectors.
- Data Modeling
- Model your data within Power BI to create relationships and calculations tailored to your business needs.
- Dashboard Creation
- Design and customize dashboards that highlight the most important metrics for your business.
- Report Automation
- Schedule automated reports to keep your team and stakeholders updated on key performance indicators.
By integrating Power BI with Business Central, businesses can gain a deeper understanding of their data. Leading to more informed decisions and improved overall performance.
https://www.linkedin.com/feed/update/urn:li:activity:7216426474600292353